Interior design & architecture
Kanaya Studio
A dark, luxe interior studio landing page where the project gallery slides sideways as you scroll, set in large serif type.
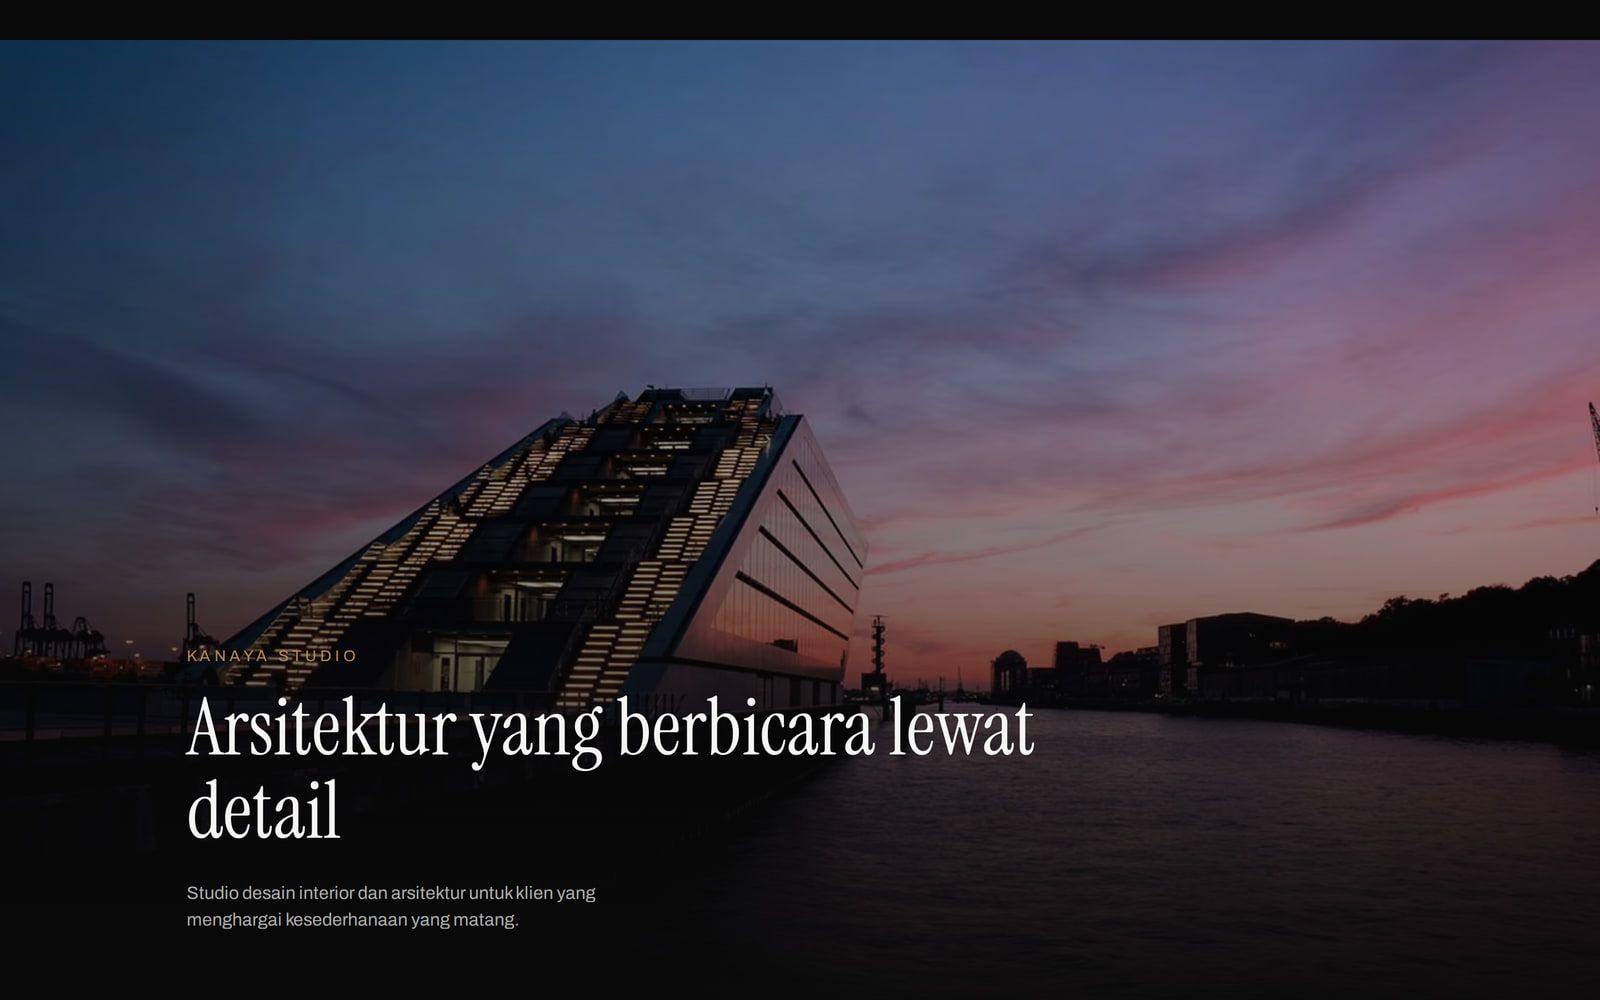
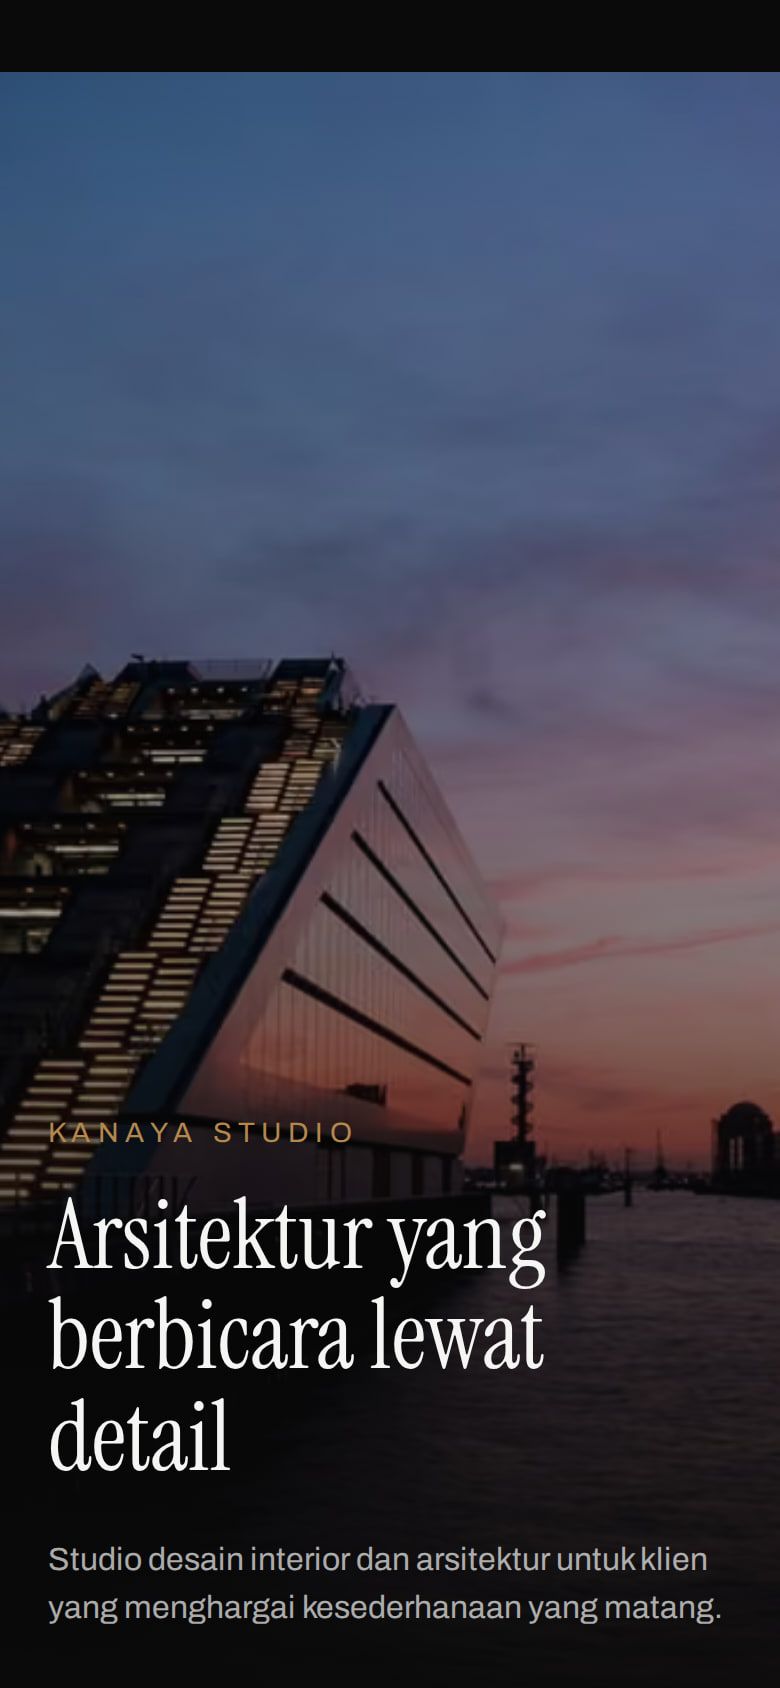
Both screenshots above are taken from the real page, not mocked up in a design tool.
The challenge
An interior studio sells taste. If the site looks ordinary, prospective clients conclude the work is ordinary too. The project portfolio that should have been the strongest asset ends up as a dull grid of photos.
There was a subtler second challenge: this project already had one dark demo (Ruang Rempah). Without a deliberate separation, the two would read as the same studio.
What was built
The darkness here is neutral and nearly colourless: deep black with a single brass accent. A long way from Ruang Rempah’s warm red-and-green. Headlines use a large serif, corners are kept perfectly square with no rounding, and the layout runs to the edges of the screen so project photography feels as wide as possible.
The project gallery is the centrepiece: as visitors scroll, the page holds still for a moment and six projects travel sideways one at a time, so each gets undivided attention instead of being one tile in a grid. On phones that movement is switched off in favour of a plain horizontal swipe, because holding the scroll hostage on a touchscreen feels wrong.
Large headlines reveal word by word, and project photos shift slightly with the cursor on desktop. Enough to feel alive, but not enough to distract.
What it measures
This is the most animation-heavy of the four demos, which makes its numbers the most interesting to check. The panel below shows the real measurements, including where it falls short: this page needs about 2.4 seconds to paint its largest element in a simulated phone test, above the 1.5-second bar used for the other demos. The cause is the animation library behind that sideways gallery, and that was the agreed price for the effect.
How this page measures
Measured with the scoring tool already built into Google Chrome, so you can run it against this page yourself (it is called Lighthouse, under developer tools). Scores run 0 to 100, higher is better. The test is set up like a phone on a slow signal, not an office computer.
- Speed (Performance)
- 97 / 100How quickly the page appears and becomes usable. This is what decides whether a visitor waits or closes the tab before anything shows up.
- Accessibility (Accessibility)
- 100 / 100How usable this page is for people with disabilities. Through a screen reader, for instance, or with only a keyboard and no mouse at all.
- Search-engine readiness (SEO)
- 100 / 100How ready the page is to be read and understood by search engines. This is the groundwork; ranking on Google still takes content and time.
These come from measuring the current version of this page. They are not targets I was hoping for, and not estimates. Where I have not measured something, it says “not measured yet”.